Abstract In this article, I provide insights on whether Elon Musk plays a role in the exorbitant price swings in the cryptocurrency exchange rate market. I provide a case study on Musk's Twitter feed and the price movements within windows of time with tweeting activity by Musk. The result is that price shows large swings when Musk tweets. However, it is not obvious that he is the catalyst for such movements. There is a general trend of volatility before Elon Musk starts tweeting. Of course Musk is a single influential figure amongst the many advocates and dissidants of cryptocurrency, therefore a larger study needs to be conducted.
The table of content is as follows:
- Introduction
- Background
- Data and Analysis
- Conclusion
Introduction:
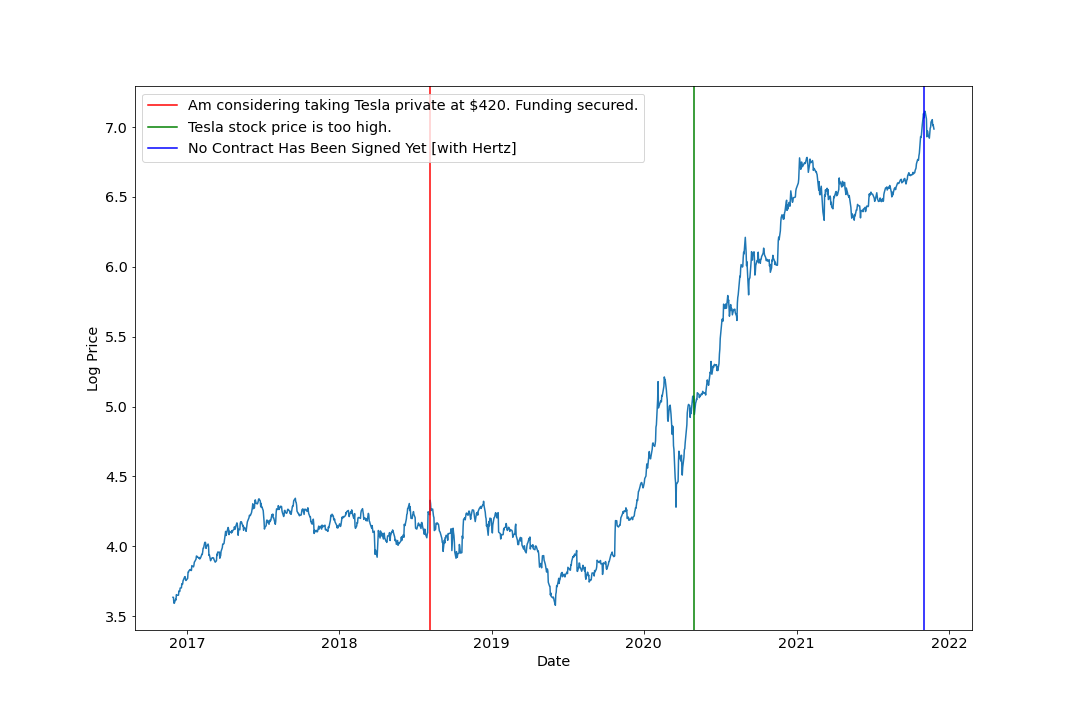
Elon Musk is one of the most prominent entrepreneurs of our generation. Known as the CEO of Tesla, Space X and The Boring Company (TBC). While most CEOs are relatively unknown and keep a low profile, Musk has built a large following in the online community. He has amassed 65.1 million followers on Twitter and is even known by the nickname Papa Musk on the infamous subreddit WallStreetbets. While many of his loyalists are impressed by his work ethic and operational achievements, some adhere to his financial thoughts as gospel. Elon has become a habitual tweeter [1]. There are many reasons why this could be. Musk is known to make official business statements on Twitter. For example, he has claimed about Tesla's acquisition by Saudi Arabia. This later got him in trouble with the SEC and caused him to relinquish his chairman position. The chart below shows some of Musk's effects on Tesla's stock. This is by no means exhaustive.
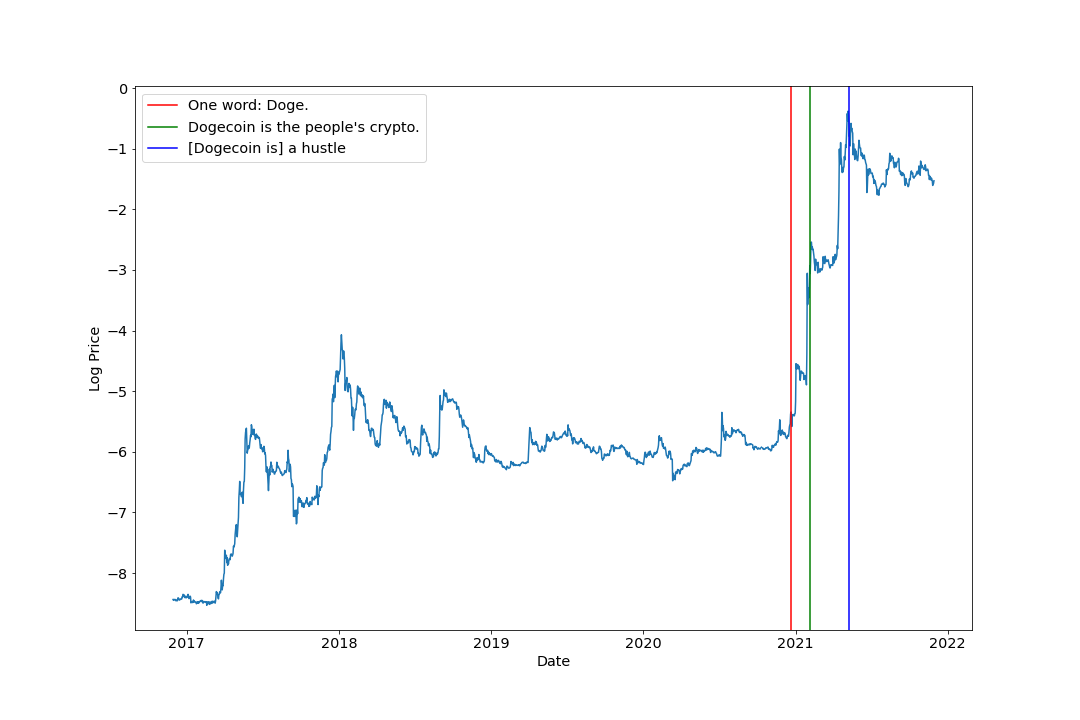
Tesla stock is not the only asset that Musk dabbles in. His tweets have corresponded to timely moves in cryptocurrencies. One that has been looked through is Dogecoin. The figure below presents a time series of the Dogecoin to USD price series. The prices are in log, and because Dogecoin has a small fractional value compared to the dollar, we end up with a negative number. In this case, we can see that Musk has some influence on the price, especially since it remains relatively flat until he tweets about it. Coincidently, these dates also correspond to a major shift in the TSLA stock price. See the appendix for a chart.
After witnessing these price movement after a statement from Elon Musk, we may wonder if this holds for a currency like Bitcoin, which has larger volume than Doge but is still prone to manipulation. The cryptocurrency sphere is more unregulated than securities and stock so they are no criminal charges to any action completed by Musk. We must see what the data tells us to surmise that he is manipulating the market.
Background
To learn more about crypto currencies, see my blog post here.Data and Analysis:
We briefly describe the data used in the paper. The price data for bitcoin/USD comes from CryptoCompare. The reason for using this data is because it is well vetted and aggregates the price across multiple exchanges to get an index for BTC/USD price. The price reported is the volume-weighted price for each day. This is computed as the \[\text{Price} = \frac{\text{Volume to}}{\text{Volume From}}\] where Volume to is the amount of USD converted in BTC and Volume From is the amount of BTC purchased. Next, we obtain the Elon Musk Twitter data from Kaggle \footnote{\href{https://www.kaggle.com/ayhmrba/elon-musk-tweets-2010-2021?select=2021.csv}{Here}}. The data is only until March 2021 so we have to append it with a few other pupular tweets that happened this year. The Kaggle data is complete; providing url of tweet, number of likes/retweets/replies etc. The data was directly pulled from the Twitter API and cleaned up to a CSV format. For the Twitter data, there are xxx tweets that Musk had in this period. We narrowed it down to ~100 relevant to Bitcoin or Crypto in some way. We did not do any NLP because of the small size. However, NLP would be a good idea if we were to add other prominent crypto enthusiasts, such as Michael Saylor. Because of the subjectivity in determining if tweets were bullish or bearish on crypto, we take a conservative approach and neutralize most of them (DO ROBUSTNESS CHECK ????). In the appendix, we list some examples of bullish and bearish tweets. We also acknowledge days where crypto related tweets did not occur. Furthermore, as a sanity check, we use Google Trends to see if Musk causes interest in crypto after his tweets. The data is only available in monthly format (\url{https://trends.google.com/trends/explore?date=2017-01-01\%202021-11-07&geo=US&q=elon\%20musk\%20crypto}). The previous TSLA stock and DOGE/USD data is from yahoo finance. We note that daily data may not be the most granular. BTC/USD price movement frequently changes with the order book. Twitter data is also high frequency, with tweets recorded up to the minute. In the age of digital information, readers get the information instantly and can take action then instead of the day after. However, our analysis is more naive and tries to avoid this complexity. As many people follow Musk, we argue that the effects of a Tweet should last at least a day.
Method
Before we begin, we display the log time series of the Bitcoin price and the associated volume. As you can see, the price has been very volatile and induces a Before we start, we need a measure of stickiness for the uptrend of bitcoin. We label this as \(s\). On average the length of price increase streak for bitcoin is .. USE EXPONENTIAL SMOOTHING THAT MINIMIZES SSE FOR EMA (\url{https://en.wikipedia.org/wiki/Exponential_smoothing#Optimization})
There are \(c \in \{1,2,...C\}\) cryptocurrencies Denote the spot price of cryptocurrency \(c\) at time \(t\) as \(S_t^c\) Denote the volume by \(V_t^c\) The daily return is \[R_t^c := \frac{\Delta S_t^c}{S_t^c} = \frac{S_t^c - S_{t-1}^c}{S_t^c}\] Note: Because of the extreme price volatility between daily returns, the approximation \(\log(S_t^c) - \log(S_{t-1}^c) \neq Denote the indication of an uptrend from period \(t-1\) to \(t\) as \[U_t^c := \mathcal{I}\{R_t^c \geq R_{t-1}^c\}\] Note that the above definition is more for momentum. The below just notices if positive of not \[U_t^c := \mathcal{I}\{R_t^c \geq 0\}\] The analogous downtrend \[D_t^c := \mathcal{I}\{R_t^c < R_{t-1}^c\}\] \[D_t^c := \mathcal{I}\{R_t^c < 0\}\] Denote the collection of periods with uptrends as \(\mathcal{U}^c := \{t: U_t^c = 1\}\) and downtrends as \(\mathcal{D}^c := \{t: D_t^c = 1\}\) Let \(s\) denote the number of periods that an up/down-trend must happen in order for it to be called a streak/trend Denote the collection of all trends as \[\mathcal{T}^c := \{t: \{t,..., t+s\} \in \mathcal{U}^c \cup \{t,..., t+s\} \in \mathcal{U}^c \}\] Note: These are random times but not stopping times because you have to look ahead in order to know if you are in a trend Denote the indicator of a part of trend by \(Y_t^c\) Let influence be denoted by \(i \in \{1,...,N\}\) Denote if the influencer tweeted in period \(t\) by the indicator \(A_t^i := \mathcal{I}\{\}\)\ Sum of tweets is \(S_A^i := \sum_{t=1}^{T} A_t^i\) Denote if the tweet was crypto related as \(C_t^i := \mathcal{I}\{\}\)\ Sum of crypto tweets is \(S_C^i := \sum_{t=1}^{T} C_t^i\) Denote the bullishness of the tweet by \[B_t^c := \begin{cases} 1 & \text{Bullish tweet}\\ 0 & \text{Neutral tweet}\\ -1 & \text{Bearish tweet} \end{cases} \]
Model & Results
Probability that there is an uptrend the day Musk tweets something crypto related \begin{align} \log \Big(\frac{\mathbb{P}[U_t = 1]}{1 - \mathbb{P}[U_t = 1]}\Big) = \beta_0 + \beta_1 S^U_{t-1} + \beta_2 C_{t} \end{align} Or is it that Musk tweets because there is an uptrend \begin{align} \log \Big(\frac{\mathbb{P}[C_t = 1]}{1 - \mathbb{P}[C_t = 1]}\Big) = \beta_0 + \beta_1 S^U_{t-1} + \beta_2 U_{t} \end{align}
Conclusion
Musk has effect on starting or stopping a trend is unclear from this analysis. It doesn't seem to be the case on daily data, but it may be different on higher frequency.
Pitfalls
Many things were glossed over in this work, and it is incomplete. We can always look at more cryptocurrencies and influencers. We could also look at the price of BTC relative to other cryptocurrencies instead of the dollar. There is no reason why we expected Musk's followers to be based in the States. But we argue that Musk's influence comes from his ability to draw in newcomers and those on the fence, unlike well-versed crypto investors who know multiple currencies. Our classification of tweets is too subjective overall, and we have to determine a method to make it more rigorous. Some more robustness checks may suffice. We did not look sufficiently into volume data. We did not look at high-frequency data, but we can argue that the effects of Musk are "sticky" We are missing tweets that only contain an image or meme. Musk tends to do this but most likely the memes were not his originally so he would not start the trend in those cases.